
So STW has recently published a snapshot of data from the insurer ProtectYourBubble, as some of the statistics present an entirely different picture to what official statistics actually say I thought it would be interesting to look at how insurance figures can actually differ from the “real” picture and update our statistics page whilst I’m at it.
Most popular brand of bike stolen
I don’t think these statistics are particularly interesting as they don’t account for a brands relative popularity (i.e there are more Specialized bikes out there, so of course more get stolen) but none the less I ran the Metropolitan Police figures against Protect Your Bubble’s and found that indeed Specialized is the number 1 brand in the UK (for both buying a bike and stealing one).
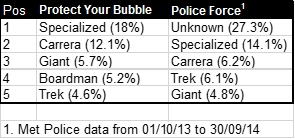
Source: Metropolitan Police Data for Make/Model of Stolen Bikes (via FOI)
What is interesting though is that a whopping 27% of people couldn’t identify the brand of their stolen bike to the police (or it wasn’t recorded).
Average value of a stolen bike
Protect Your Bubble say that “The average cost of a stolen bike was £974.80“, whilst the Home Office reduces that figure down to £337.
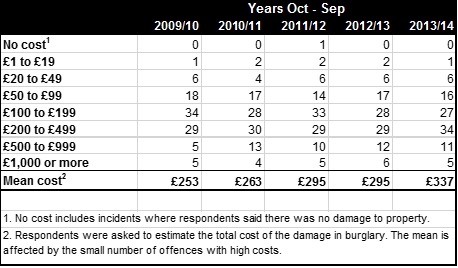
Source: Crime in England and Wales Survey, 2013/14
I’d put the difference down to people being more likely to insurer their £1,000 bike.
Type of locations bikes are stolen
Protect Your Bubble say “Of those who claimed for a stolen bicycle, 72% had it stolen from a location other than their home, while 23% had their bicycle stolen from their home.” (not sure what happened to the other 5%).
The Home Office statistics are almost reversed with 68% of bikes being stolen from an owners home, 5% being stolen from a work place, and 27% being stolen from other locations (this adds up to 100%).
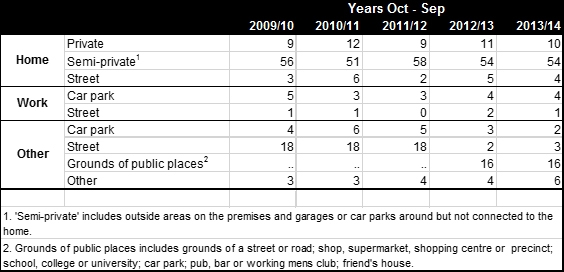
Source: Crime in England and Wales Survey, 2013/14
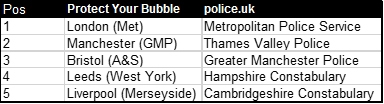
Top five postcodes for bicycle theft
A rather pointless list as it will largely just highlight areas with high bike use but it’s interesting that the insurers data points to London as dominating the top 5, whilst Oxford and Cambridge are clearly a favourite for thieves on the official data. Perhaps this could be put down to the type of person who is likely to buy bicycle insurance.
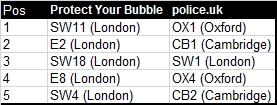
Source: data.police.uk (based on May 13 to Apr 14)
Top five towns and cities for bicycle theft
Whilst we don’t have a direct comparison for this I do have the data for each police force, which provides a rough guide to how this data changes, again I suspect differences will largely be based on the type of person who insurers their bike.