Stolen Bike Study
Last Updated August 2016
Were Victims of Bike Theft
%
Didn't Tell the Police
%
Gave up Cycling
%
Cycled Less
Police Force Statistics
UK Wide
Bike theft dropped by 25.2% from 2011 to 2016.
Merseyside Police
Over the last 5 years bike theft has risen by 2.96% in Merseyside, the only police force area to register an increase
Devon and Cornwall
In the same time period bike theft dropped by a whopping 46.92% in Devon and Cornwall
Cambridgeshire
Cambridgeshire has the worst rate of bike thefts at 4.34 per 1000 residents every year.

- Stolen in the evening or night 58%
- Stolen from a Semi-Private Area (Garage, Shed, Hallway) 53%
- Hadn’t locked their bike when it was stolen 59%
- Were valued at between £200 & £499 31%
Crime in England and Wales Survey
The Crime in England and Wales Survey is performed by the home office in order to measure crime (not just those reported to the police), various questions are asked of those that take part regarding bike theft and all sorts of interesting statistics can be gleaned from the data. For example why people aren’t locking their bikes, how much the average stolen bike cost, where are bikes being stolen from, etc.
Stolen Bike Survey
When Buying a New Bike
89% of buyers didn’t get any security advice
79% of buyers think they should
70% would prefer a retailer that offers security advice
Classifieds
96% said they weren’t doing enough to combat theft
56% said they should offer more advice about avoiding stolen bikes
97% said they should ask for a frame number from the seller
Frame Numbers
76% said they had recorded their frame numbers
15% said they hadn’t got round to it yet
97% would use a service like CheckThatBike!


Police.UK
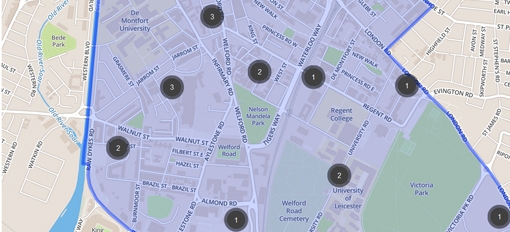
The police.uk website is a crime statistic website run by the Home Office, it offers the most up to data statistics on all sorts of crime including bike theft. Searchable by postcode, city or county it’s easy to pull out maps and statistics from this website.
